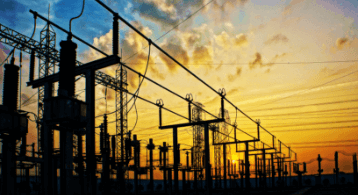
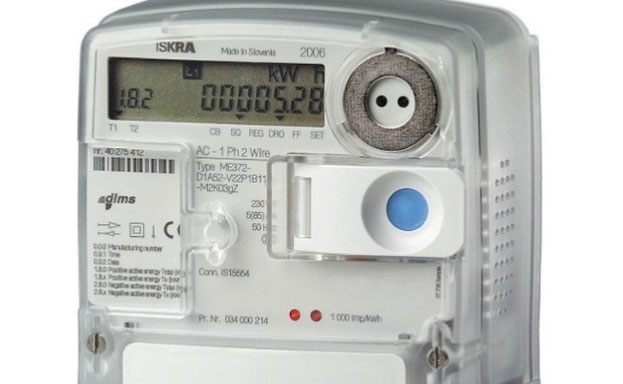
Electricity losses can happen in the transmission or distribution activities. There are different ways to calculate electricity losses, and the section on best practices presents some of these.Most of the electricity losses (around 70-80 percent) are related to the distribution end-user activities, as the transmission losses are usually between 20-30 percent of the total. In LAC for example a study estimated that 18% of losses are in transmission while 81% are in distribution3 This ratio however is not constant when compared to other regions. Other studies identified transmission losses in the USA were around 50% of total losses4.
Electricity losses is an important consideration in the LAC region as they represent an estimated financial cost for the electricity industry that ranged from US$11 to US$17 billion in 2012, equivalent to 0.2 to 0.3 percent of the region’s GDP. Total losses in LAC are around 17%, while for example in the USA it is around 5%5 . Estimates from the IDB study indicate that after allowing for a conservative level of technical losses, the percentage of losses translated into 100 TWh lost in 2012, and without substantial reductions in the future, losses can go up to 182 TWh in 2030.
In this context, the reduction in electricity losses brings important financial benefit to the distribution utility but they cannot be an isolated activity. The reduction of losses is usually part of a strategic transformation of the utility with other performance improvement activities as it requires prioritization of investments and allocation of teams. These are described later in the best practice section.
Electricity losses can be divided in two parts:
-
Technical losses: correspond to all the energy dissipated in the transport of electrical current in conductors, equipment, and connections due to resistance in the distribution network. Technical losses can be further divided into: (i) fixed technical losses (caused by physical inefficiencies such as hysteresis, Eddy Currents losses in the iron core of transformers, and the corona effect in transmission lines) and (ii) variable technical losses (which can happen when power current flows through the lines, cables, and transformers of the network. These are also called load losses, or series losses).
-
Non-technical losses or commercial losses are those usually associated with the sale of energy supplied to the end user. There is a part of the energy that is produced, transported and supplied; however, it is not invoiced, or it is invoiced but not paid. These losses can be caused by internal or administrative problems (such as errors in measurement, accounting or record keeping) but they are usually associated with the consumer's own illegal intervention, such as thefts, fraud, alteration of meters, or unmetered supply (when the consumer is responsible).
The reduction of losses is a key activity in the transmission and distribution sub-sectors. However, due to the elasticity of demand, the implementation of a loss reduction program can also affect the generation due to the overconsumption. This is due to the electricity “subregistry” corresponding to the energy consumed by the client that does not circulate through the meter, which is actually reduced from the moment a customer is required to pay for its consumption. By promoting the rational, productive, and efficient use of electricity by consumers, it is estimated that after regularization of the customer, approximately 1/3 of the unregistered consumption does not need to be generated.
At the same time, the regularization of electricity services improves the wellbeing of customers as residential consumption of modern energy sources is correlated with per capita income6. The regularization of services also enables the possibility of using electricity for productive activities and further economic development.
Based on available methodologies and definitions, it is possible to calculate the indicators of electricity losses by country, utility, and further segmentation by geography based on the availability of data. Whenever possible these indicators must consider the distributional impact of the losses, in particular to those parts of the society which are more vulnerable and have less resources.
Lastly the assessment to develop an electricity loss reduction program needs to acknowledge that the level of effort and activities would be different depending on the level of losses of the utility. For illustration purposes, the following chart7 presents the electricity losses in LAC (technical and non- technical) at country level, which already combines of one or more utilities in a country. For example, Brazil is represented with the average of 17% but the electricity los across the 52 utilities range from 7% to 32%. The wide dispersion at country and regional levels exemplifies that the starting point for each country is different and therefore the activities selected in the toolkit have to be tailored to each country (and utility) situation.


